Reporting statistical results is an essential part of an academic thesis, particularly in quantitative studies. It is not only important to present the correct data, but also to present it clearly and comprehensibly. In this blog post, you will learn how to structure and present the results section of your thesis effectively.
The results section plays a central role in your dissertation, as this is where the answers to the research questions raised in the dissertation are presented. This section of the dissertation requires precision and clarity to ensure that readers can interpret the findings fully and correctly. But what is the best way to report statistical results correctly in a dissertation?
The structure of the results section
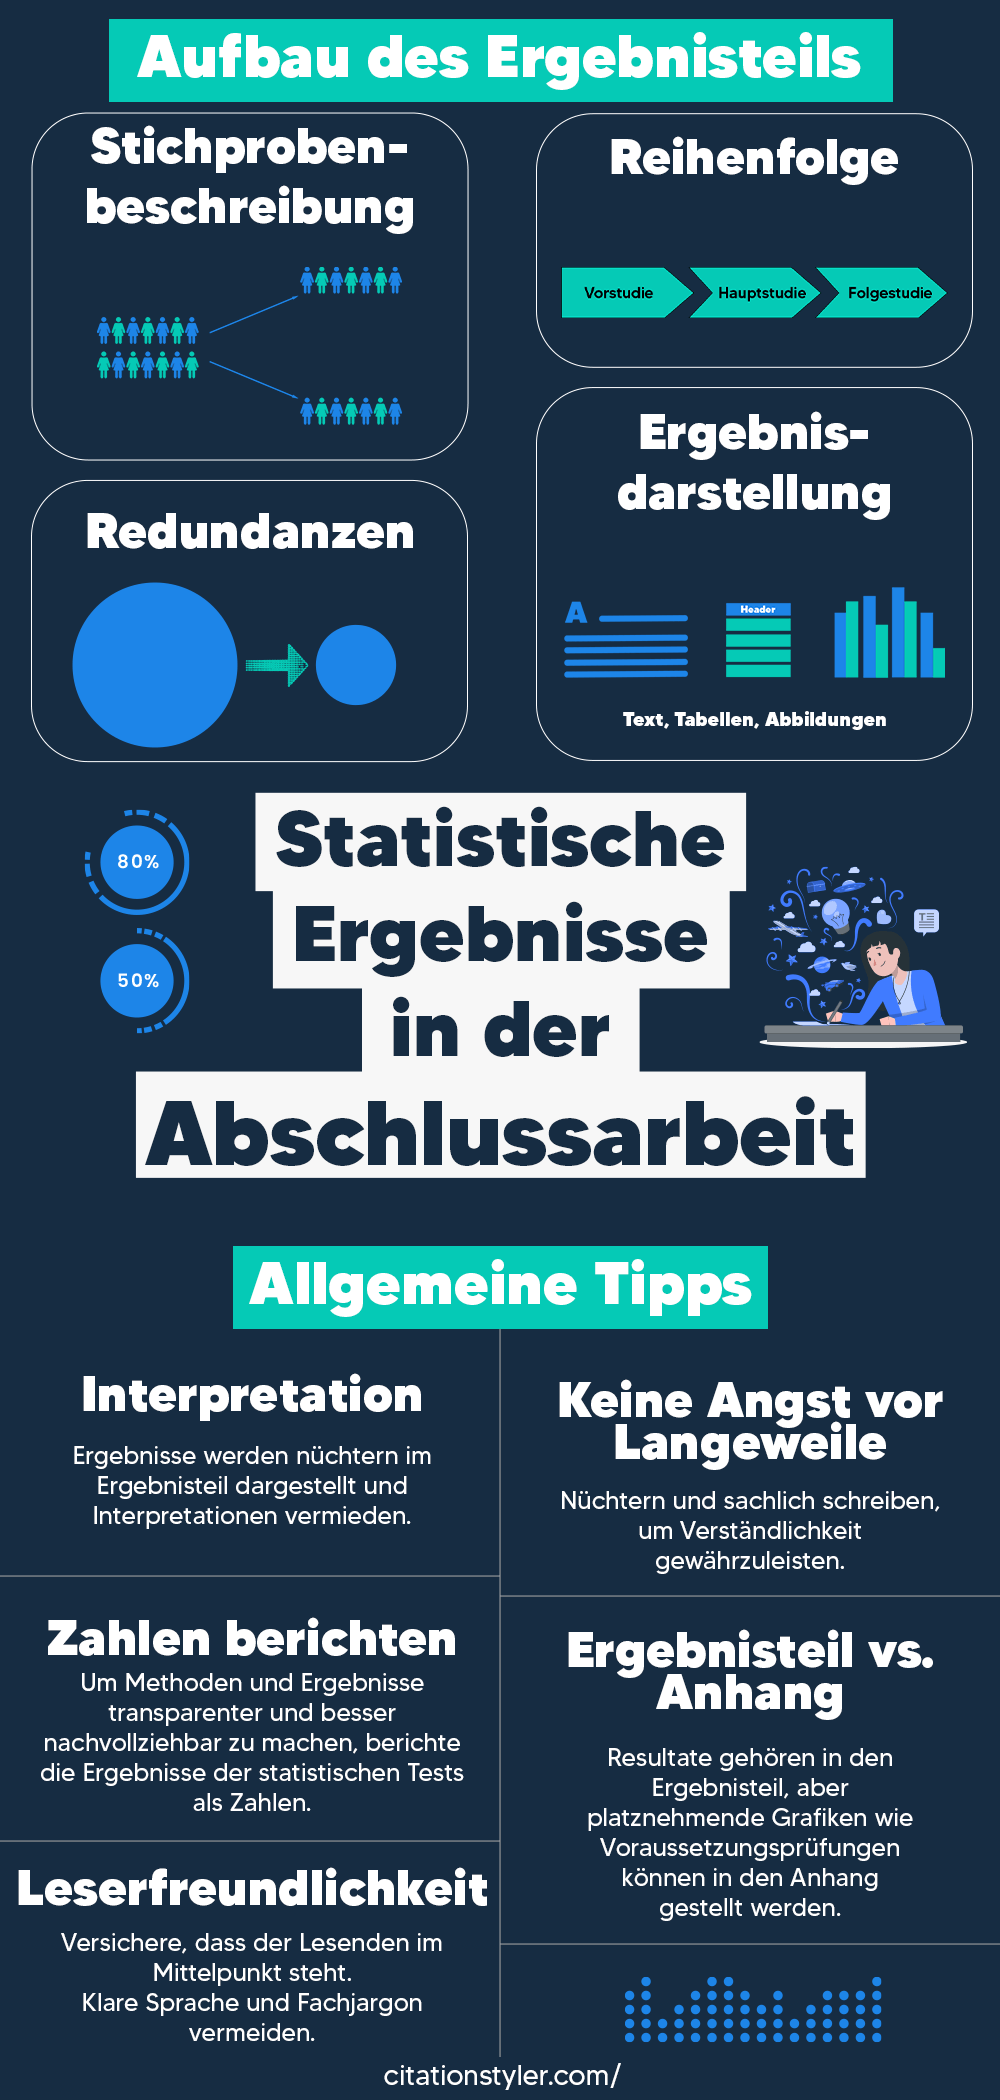
1. The importance of the sample description
It is customary to begin the results section with a description of the sample. This description serves to give readers a clear picture of the group(s) or data set under investigation. In the case of individuals, this often involves basic demographic characteristics such as age, gender and socio-economic status. Depending on the topic, pre-existing conditions or other specific characteristics may also be relevant to your sample description. If you are not working with people but with other
An example:
If, for example, your study mainly involved women, whilst the overall population you wish to represent comprises both men and women, it is important to make this clear. This alerts the reader to the fact that the results may not be generalisable to the entire population.
2. The order
The results section should be logical and clearly structured . There are no strict rules, but it is common practice to present the results in the order of the hypotheses or research questions. This helps to guide the reader through the researcher’s line of reasoning and to present the results in a clear and coherent context. For example, if your study tests several hypotheses, it makes sense to report them in sequence to avoid confusion.
It is also useful to distinguish between preliminary, main and secondary analyses, and to structure them accordingly. This might mean, for example, that you first present the results of the main study and then, in a separate section, the follow-up analyses. You may have carried out preliminary analyses before testing your hypotheses. This could, for example, be a correlation analysis for all the variables under investigation. In that case, you will present these results before reporting on the main analyses.
3. Presenting results: text, tables and figures
The results section usually comprises three main elements: text, tables and figures. Each of these components has its own function and should be used strategically.
a) Text
The text should be used to describe the key findings and explain their significance. Its purpose is to provide readers with a narrative structure and to place the findings in the context of the research questions. Make sure you focus on the most important figures and statistical indicators and do not simply list a series of values. The text should be clear, precise and free from unnecessary repetition.
b) Tables
Tables are ideal for presenting a large amount of data in a compact and clear manner. They should be used when the text would become confusing if it contained too many figures. It is important that tables are designed sensibly; in other words, they should not contain redundant information and should be clearly structured. Every table must be mentioned and explained in the text so that the reader understands what information can be gleaned from it. Avoid repeating all the figures contained in the table in the text; instead, highlight only the most relevant ones and refer the reader to the table for further details.
c) Figures
Figures provide a visual representation of data and can be particularly useful for illustrating trends or patterns that would be difficult to understand from a table or the text alone. For example, figures are ideal for showing trends over time or comparisons between groups. The same applies here: figures should be clearly labelled and must be incorporated into the text and explained. Avoid decorative figures that do not provide any additional insight.
Pro tip:
In the APA style guide (Publication Manual of the American Psychological Association, Seventh Edition (2020)), you will find more detailed rules on the formatting of tables and figures, along with many practical examples.
4. Avoid redundancies
A common problem when reporting results is the redundancy. It is important not to repeat the same information unnecessarily. When you create a table or figure, you should avoid repeating the information it contains in full in the text. Instead, you can refer to the table or figure in the text and highlight only the most important points.
General tips for reporting statistical results
1. Reader-friendly presentation
Whenever you present your results, remember to put the readers at the centre . Think about how you can present your information in a way that is easy to understand for someone who is not deeply familiar with your subject. Use simple and clear language and avoid technical jargon wherever possible. If you use complicated or unfamiliar statistical methods, explain them briefly in the methods section.
2. Choosing the right format
Choose carefully when to use text, tables or figures. A well-structured text can help the reader keep track of the information, whilst tables and figures make the information visually accessible. Each form of presentation has its own advantages, and the right combination can present your findings much more clearly and convincingly.
3. No interpretation yet
The results section stays away from any form of interpretation yet. Here, the results are simply reported objectively. You describe what the result means, purely from a statistical point of view, for your research question. For example, whether a particular hypothesis has been rejected or not. However, you do not yet evaluate the results, place them within the full context of your work, or draw connections to existing theories or the current state of research. That comes later in the discussion.
4. Don’t be afraid of boredom
The results section should be written be level-headed and objective . Do not try to break up the monotony by varying your choice of words or sentence structure too much. Too much variation can ultimately make the text difficult to understand. In the introduction and the discussion, you are welcome to vary your language more. The results section, however, is allowed to sound dry as dust. It will automatically do so if you write in a very factual and standardised manner, as is necessary for the results section.
5. Financial statements or notes to the accounts
In principle, all your results are reported in the results section, and everything you have calculated should be verifiable there. However, there are some things that for reasons of space and because they aren’t very important, you can put into your annex These include, for example, the results of assumption tests, such as Q-Q plots used to check for a normal distribution. These take up a lot of space and are fundamentally important, but are not relevant to the results themselves. They are therefore best placed in the appendix, and you should refer to them in the results section. The same applies to large tables, such as the factor loading matrix from a factor analysis.
6. Figures tell a story too
In addition to descriptive statistics such as frequencies, means and standard deviations, the reports also include the results of the statistical tests as figures. Bear in mind that, when discussing significance tests, you should not only state the p-value, but also the test statistic and – where applicable – the degrees of freedom. This will make your methods and results more transparent and easier to follow. Bear in mind, too, that your readers may well be interested in further findings that are not particularly relevant to you personally. If you provide them with a little more information, they will be able to make better use of your work. For example, reporting effect sizes could help a reader to use your findings as a basis for calculating sample size when planning her own study.
Conclusion
Reporting statistical results in your dissertation requires care and a well-thought-out structure. By following a clear and logical sequence, avoiding repetition and choosing the appropriate format, you can present your results accurately and clearly. Always bear in mind that readers must be able to understand your work, even if they are not deeply familiar with your field of specialism and are not well acquainted with the methods you have used. If you follow these principles, you will produce a coherent and convincing results section that meets academic standards and highlights the significance of your research as the central outcome of your work.
Daniela Keller is a statistics expert, and advises undergraduates, PhD students and research groups on all aspects of statistics – from study design and data analysis using appropriate software to the presentation of results. She also runs the Statistik-Akademie , an online members’ area for anyone who understands statistics and wants to apply them themselves. You can also find further tips on statistics and answers to your questions about statistics in her blog and on her YouTube channel.
Learn how to install a custom .csl citation style in Zotero - whether received from a publisher or purchased from my shop. Step-by-step instructions including verification in Word's document preferences!
Comparison of citation software: Which tool is the best for your academic work? We analyse the development of Zotero, Mendeley, EndNote, JabRef and Citavi and show you which program is currently in vogue.
The Zotero fork Juris-M no longer synchronises and is considered abandoned. However, there are new developments: a new plugin is bringing jurisdictions, legal styles and parallel citations back to the current version of Zotero – still in alpha, but at an astonishing pace. What Juris-M users should know and do now.
Sometimes in Zotero, you need to add sources to your bibliography that have not been directly cited, such as the book containing a specific chapter. Here, I will show you how to do this easily.
We use cookies to improve your browsing experience, display personalised adverts or content, and analyse our website traffic. By clicking ‘Accept all’, you consent to the use of cookies. You can change or withdraw your consent at any time by clicking the settings icon.
Adjust settings
We use cookies to enable you to navigate our website efficiently and to carry out certain functions. You can find detailed information on all cookies below, under the relevant consent categories.
Cookies classified as ‘necessary’ are stored in your browser, as they are essential for the website’s basic functions.
We also use third-party cookies to help us analyse your use of this website, save your settings and provide you with content and marketing materials that are relevant to you. These cookies are only stored in your browser with your prior consent.
You can enable or disable some or all of these cookies; however, disabling some of them may affect your browsing experience.
Always Active
Necessary cookies are required to enable the basic features of this site, such as providing secure log-in or adjusting your consent preferences. They are not used for advertising or to track you across other sites. The consent cookie stores a random identifier that lets us keep a record of the choice you made.
Cookie
PHPSESSID
Duration
session
Description
PHP session cookie for managing user sessions.
Cookie
selectedTab
Duration
session
Description
Cookie
woocommerce_items_in_cart
Duration
session
Description
WooCommerce cookie to track items in cart.
Cookie
woocommerce_cart_hash
Duration
session
Description
WooCommerce cookie to determine cart contents changes.
Cookie
_GRECAPTCHA
Duration
6 months
Description
Used by Google reCAPTCHA to distinguish between humans and bots.
Cookie
fazcookie-consent
Duration
6 months
Description
Stores the visitor’s cookie consent choices and a random consent ID used to keep a record of this choice.
Always Active
Functional cookies help perform certain functionalities like sharing the content of the website on social media platforms, collecting feedback, and other third-party features.
Cookie
timezone
Duration
session
Description
No description available
Cookie
tk_ai
Duration
session
Description
Stores a randomly-generated anonymous ID. This is only used within the dashboard (/wp-admin) area and is used for usage tracking, if enabled.
Cookie
wmc_current_currency
Duration
1 day
Description
Cookie supplied by Woo Multi-Currency
Cookie
__stripe_mid
Duration
1 year
Description
Stripe fraud prevention cookie for payment processing.
Cookie
__stripe_sid
Duration
30 minutes
Description
Stripe fraud prevention session cookie for payment processing.
Cookie
cf_clearance
Duration
session
Description
Whether a CAPTCHA or Javascript challenge has been solved.
Cookie
LOGIN_INFO
Duration
2 years
Description
This cookie is used to play YouTube videos embedded on the website.
Always Active
Analytical cookies are used to understand how visitors interact with the website. These cookies help provide information on metrics such as the number of visitors, bounce rate, traffic source, etc.
Google Analytics 4 cookie used to persist session state.
Cookie
_ga
Duration
2 years
Description
Google Analytics cookie used to distinguish users.
Cookie
sbjs_migrations
Duration
session
Description
Technical data to help with migrations between different versions of the tracking feature
Cookie
sbjs_current_add
Duration
session
Description
Timestamp, referring URL, and entry page for your visitor’s current visit to your store
Cookie
sbjs_first_add
Duration
session
Description
Timestamp, referring URL, and entry page for your visitor’s first visit to your store (only applicable if the visitor returns before the session expires)
Cookie
sbjs_current
Duration
session
Description
Traffic origin information for the visitor’s current visit to your store
Cookie
sbjs_first
Duration
session
Description
Traffic origin information for the visitor’s first visit to your store (only applicable if the visitor returns before the session expires)
Cookie
sbjs_udata
Duration
session
Description
Information about the visitor’s user agent, such as IP, the browser, and the device type
Cookie
_clsk
Duration
1 day
Description
Microsoft Clarity session cookie.
Cookie
_gid
Duration
24 hours
Description
Google Analytics cookie used to distinguish users.
Cookie
_gat
Duration
1 minute
Description
Google Analytics cookie used to throttle request rate.
Cookie
CLID
Duration
1 year
Description
The cookie is set by embedded Microsoft Clarity scripts. The purpose of this cookie is for heatmap and session recording.
Always Active
Performance cookies are used to understand and analyse the key performance indexes of the website which helps in delivering a better user experience for the visitors.
No cookies to display.
Always Active
Cookies that have not yet been categorized.
No cookies to display.
Always Active
Marketing cookies are used to provide visitors with customised ads based on the pages you visited previously and to analyse the effectiveness of the ad campaigns.
Cookie
sib_cuid
Duration
session
Description
Used by Sendinblue to link website activity with marketing campaigns. Facilitates marketing automation, personalization, lead scoring, and retargeting.
Cookie
_gcl_au
Duration
90 days
Description
Google Ads conversion linker cookie.
Cookie
_fbp
Duration
3 months
Description
Facebook Pixel cookie used for advertising and analytics.
Cookie
YSC
Duration
session
Description
YouTube cookie used to track views of embedded videos.
Cookie
VISITOR_INFO1_LIVE
Duration
6 months
Description
YouTube cookie used to estimate bandwidth and display settings.